Portfolio

Forecasting Model: The spreading COVID-19 cases in the world

  • WHO, along with John Hopkins University (JHU), collects data related to COVID-19 and provides insights in the form of a dashboard.
  • This project will collect COVID-19 datasets from various sources and explore how the number of cases is increasing in different countries.
  • The project aims to forecast whether partial and complete lockdowns have any effect in decreasing the number of cases and identify if cases are rising due to community transmission or overseas travel.
  • Python and Jupyter Notebook were used, employing linear regression as a predictive model and improving it using polynomial regression.
  • Criteria for evaluation such as Mean Square Error (MSE), Mean Absolute Error (MAE), and Rsquared (r2) were used for regression problem, and F-score was used to calculate the accuracy.

Building spreadsheet and data visualization: Investment real estate and demographics in Australia

  • Built the spreadsheet using Microsoft Excel to define the allocated suburb is having a potential investment in real estate.
  • Based on an Excel spreadsheet about house and vacant land by suburb 2010-2020 downloaded from VIC Environment, Land, Water and Planning with the median price throughout 10 years period.
  • Built a report based on given data to pursue which business should invest in this suburb and which types should invest house or vacant land.
  • Data visualization about the demographics of members of the Australian population born in certain countries over the past 30 years (1996-2016) using Tableau.
  • Used csv file contained the estimated population of Australia from 1996 to 2016 (every 5 years at census year), separated by states, ages (5 years), sexes and the countries of birth, sourced ABS.
  • Used Excel to perform data manipulation, Tableau to create an interactive dashboard about temporal trends, demographic distributions and construct StoryBoard to explain particular aspects.

Breast Cancer

  • Using Jupyter notebook to clean data and manipulated dataset for analysis.
  • Create a dashboard in Tableau to demography breast cancer cases which includes survival months, patient status and rating alive by race and ages

Analyst customer feedback

  • Analyse using Jupyter Notebook to make the analyst quantitative data and qualitative data.
  • Qualitative analyst using Verbatim and Overall Rating data:
    • Stop word to seperate word by word to category negative word and positive word.
    • Analysed using Sentiment Intensity Analyzer.
    • Train and test data and logistic regression.
  • Quantitative analyst using the rest of data:
    • Analysed the relationship and difference between time used service, money spent and overall satisfaction of customer.
    • Sorted how many type of time used service and range of money spent of customer.
    • Create the plot flowing by four range of time to see the change of rating from customer.

Jung Talents

  • Using Python to take their list of securities, and load it into Euler's proprietary security management platform.
  • Firstly identifying valid securites, then uploading attributes for these
  • Using MySQL to calculate percentage Distribution Total Sales by Product Category and the contribution against total sales amd create a spread a fixed value of 2,000 across all products based on this distribution percentage
  • Find the 2 most common products purchased together in an order
  • Develop a PowerBI dashboard that support strategic decision making.
  • Develop Tableau a dashboard to see any key trends in the data which can help me avoid default-prone customers in the future.
  • Using MySQL to understand what the overlap is between 2018 payment totals for their biggest clients and the rank of the overall payment totals within each entity.
  • Provide a csv containing the client IDs for 2018's top 20 clients when sorted on payment amount, as well as the entity type, 2018's total payment amount, and their overall payment amount rank within the entity they belong to.

R Studio

  • Produce a scatterplot of the data and comment on the features of the data and possible relationships between the response and predictors and relationships between the predictors themselves and compute the correlation matrix. Fit a model using all the predictors to explain the survival response and conduct an F-test for the overall regression
  • • Produce an ANOVA table for the overall multiple regression model (One combined regression SS source is sufficient)
  • Using model selection procedures discussed in the course, find the best multiple regression model that explains the data. Validate your final model and comment why it is not appropriate to use the multiple regression model to explain the survival time
  • Using kml.dat, checking is the design balanced or unbalanced
  • Construct two different preliminary graphs that investigate different features of the data and comment and analyse the data, stating null and alternative hypothesis for each test, and check assumptions
  • State your conclusions about the effect of driver and car on the efficiency kmL

Skills

Technical Skills

  • Microsoft Office: Excel, Word, PowerPoint
  • Statistical programming: R, MySQL, Python (pandas, scikit-learn)
  • Data visualization: Tableau, Power BI, Matplotlib
  • Data preparation: collecting and cleaning data
  • Mathematical and statistical skills
  • Professional Skills

  • Communication
  • Public Speaking
  • Problem-solving
  • Data preparation: collecting and cleaning data
  • Education

    November 2020 - December 2022: Macquarie University

    • Bachelor of Information Technology Major Data Science

    January 2020 - October 2020: Macquarie University International College

    • Diploma of Information Technology

    Experience

    Market Research Interviewer

    McNair yellowSquares | 03/2022 - Present

    • Collects and reviews information collected and compiles reports to pass back to the organisation/individual commissioning the market research.
    • Makes outbound and inbound calls through CATI software phone survey system.
    • Collects questionnaires, diaries, and other research materials left with interviewees and conducts follow-up interviews.
    • Records progress of respondents by noting answers, completing questionnaires, making audio or visual recording into computer.
    • Approaches members of the public, individuals, households and organisations to arrange and conduct face-to-face interviews, telephone interviews, focus groups, panel interviews etc.

    Data Entry

    Viet Nam Post | 06/2021 - 01/2022
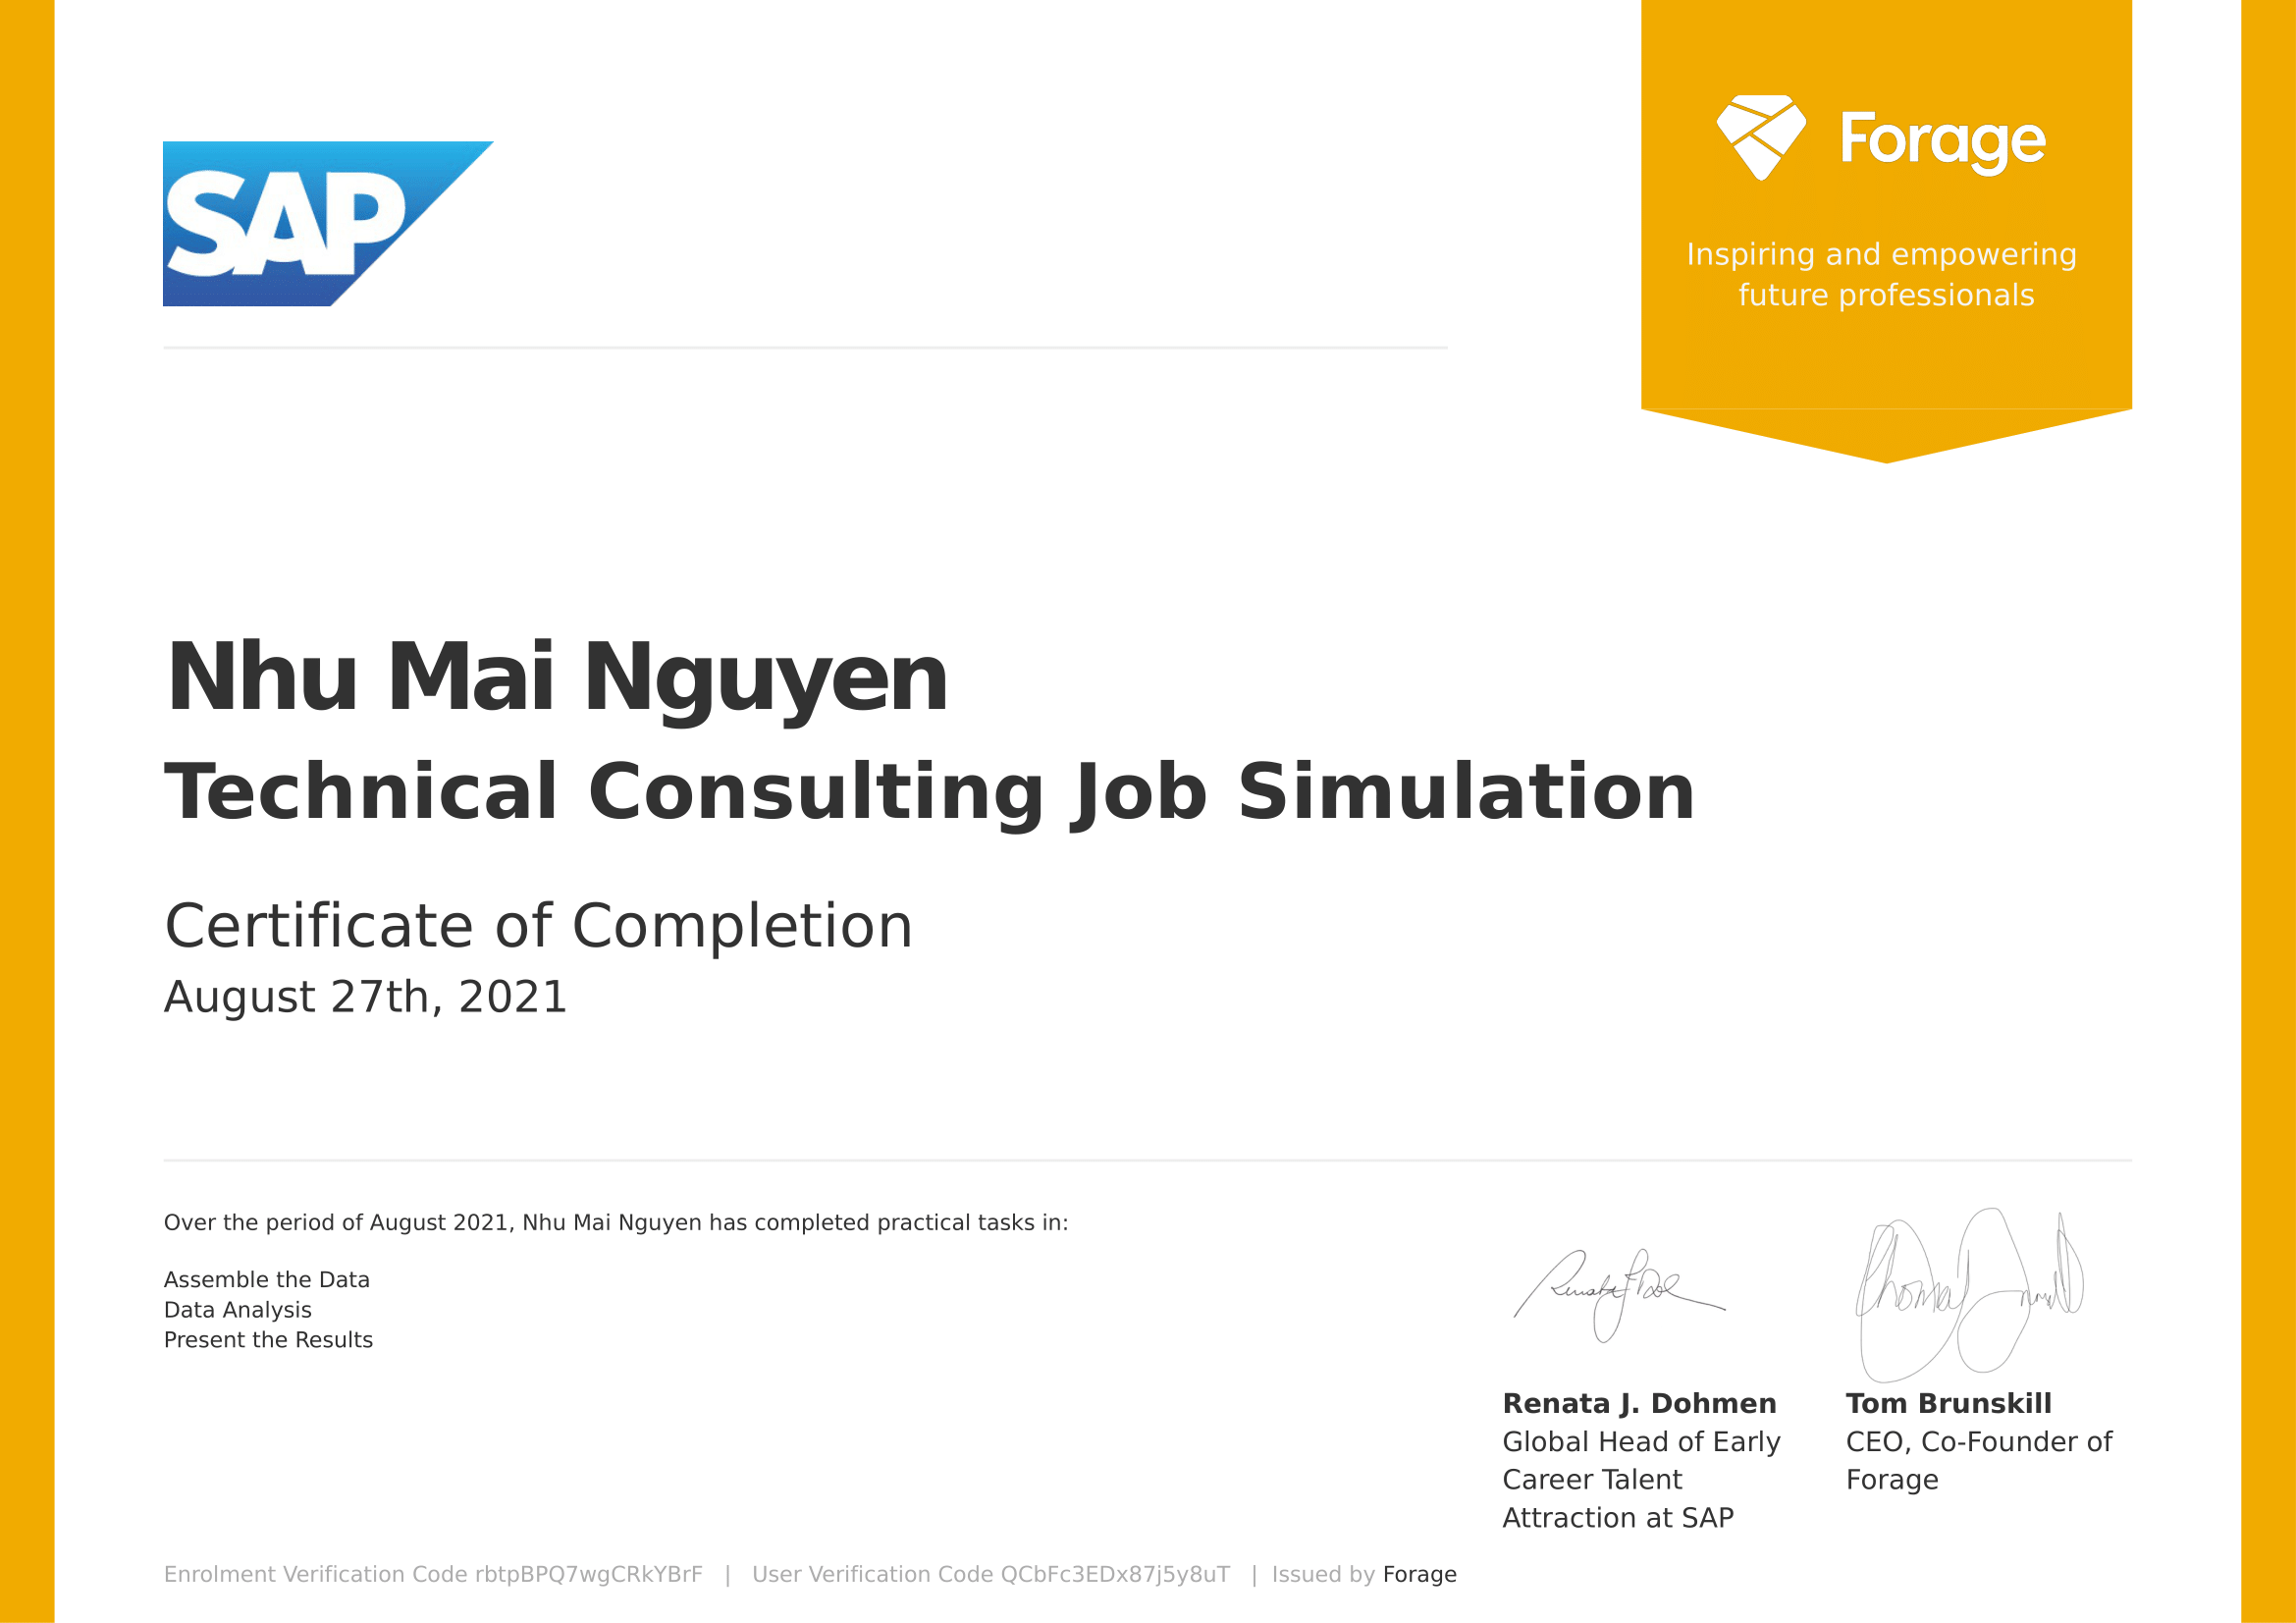
    • Prepared and sorted documents for data entry, supported to create digital map and lane to have optimal performance timing for delivery.
    • Entered data into database software and checked to ensure the accuracy of the data that has been inputted.
    • Supported analysis sales, production parcels and forecasted the cost of fuel in season by collected and sorted data by request of authorised members.
    • Scanned documents and saved in database to keep records of essential organizational information.
    • Resolved discrepancies in information and obtained further information for incomplete documents.